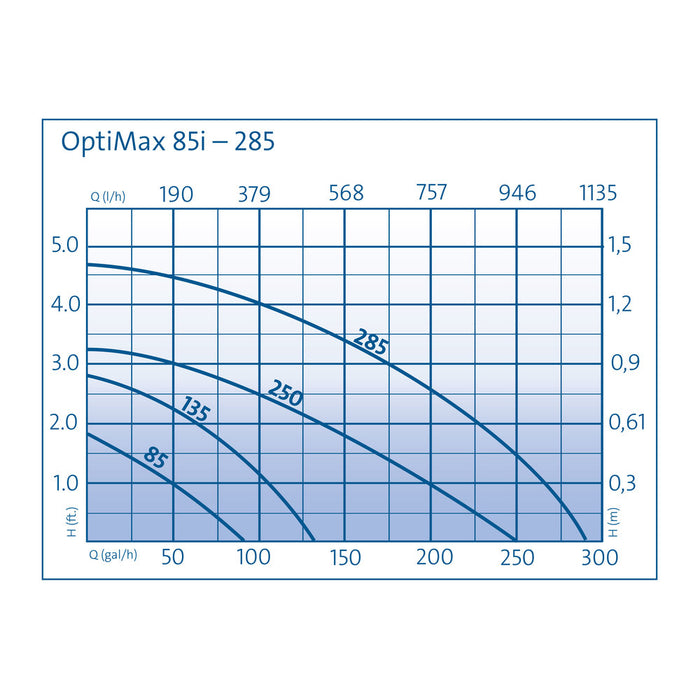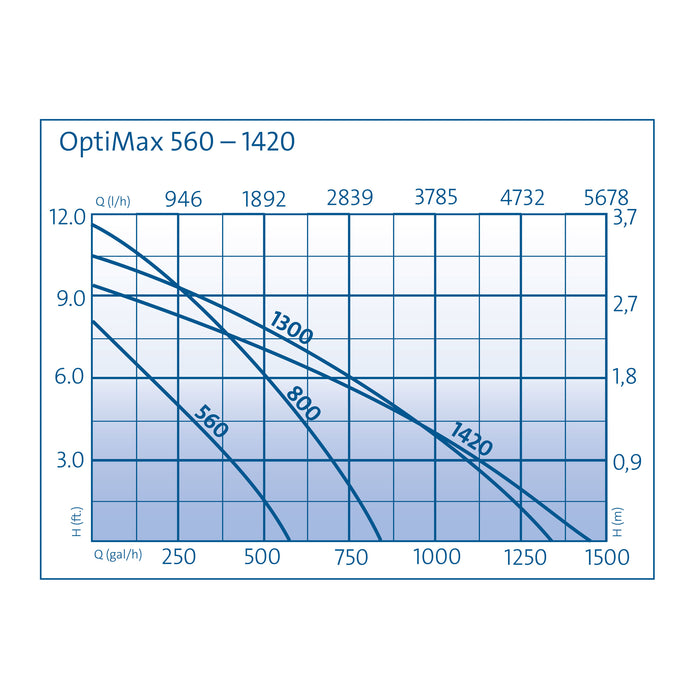
What is the pump performance curve used for? The pump performance curve (performance data) shows the relationship between the flow-rate (Q) and the delivery head (H) of a pump.
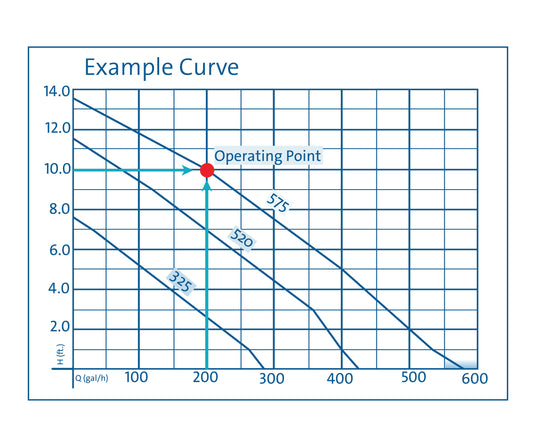
Determining the operating point (using the example curve). The pump should displace water 10 ft. above the water surface. At the operating point you can read out that approx. 200 gal / h are displaced (determined theoretically). Small tubing diameter, the tubing length and built-in curvature can change the value extremely.


